
[왕초보] 마케터, 기획자를 위한 실전 데이터 분석 2주차[파이썬,python] -스파르타코딩클럽
구글링 팁

[1] 데이터 분석 파이썬 문법
코랩활용
https://colab.research.google.com/notebooks/welcome.ipynb
Welcome To Colaboratory
Run, share, and edit Python notebooks
colab.research.google.com
파이썬 문법
#리스트 인덱스로 데이터를 호출 하는 연습을 해봅시다.
list_exercise = [3,4,[5,6],8]

print(list_exercise[2])
print(list_exercise[2][1])

#dic_exercise로 딕셔너리 값을 호출 하는 연습을 해봅시다.
dic_exercise = {'name':'bob','age':21,'height':180}

print(dic_exercise['name'])
print(dic_exercise['age'])
print(dic_exercise['height'])

age = 20

if age >= 20:
    print('성인입니다')  # 조건이 참이면 성인입니다를 출력
else:
    print('청소년이에요')  # 조건이 거짓이면 청소년이에요를 출력

# age = 17 로 하면 무엇이 출력될까요?

# 조건을 여러 개 사용하고 싶을 때
age = 65

if age > 80:
    print('아직 정정하시군요')
elif age > 60:
    print('인생은 60부터!')
else:
    print('아직어려요!')

# age = 20 하면 무엇이 출력될까요?

fruits = ['사과', '배', '감', '귤']

for fruit in fruits:  # fruit 은 우리가 임의로 지어준 이름입니다.
    print(fruit)  # 사과, 배, 감, 귤 하나씩 꺼내어 출력합니다.


fruits = ['사과', '배', '배', '감', '수박', '귤', '딸기', '사과', '배', '수박']

count = 0
for fruit in fruits:
    if fruit == '사과':
        count = count + 1

# 사과의 갯수를 출력합니다.
print(count)


#파이썬의 비교 연산자
x = 5
y = 10
ans1 = x > y
ans2 = y > x

print(ans1) #False
print(ans2) #True

#결과는 키가 170 이상인 학생인 김철수, 양승화, 이진화 순으로 출력 됩니다.
student_height = {"김철수" : 171, "슬기": 160, "승화": 180, "진화": 175}

for x in student_height:
    if(student_height[x]>170):
        print(x)
[2] pandas 를 이용하여 데이터 분석하기
https://s3.ap-northeast-2.amazonaws.com/materials.spartacodingclub.kr/data/week2/train.csv
import pandas as pd

titanic = pd.read_table('train.csv',sep=',')
titanic.head(5)
titanic= titanic.dropna()
corr = titanic.corr(method='pearson')
corr = corr[corr.Survived!=1]
corr
[3] matplotlib를 이용하여 분석 결과 시각화
import pandas as pd

titanic = pd.read_table('train.csv',sep=',')
titanic.head(5)
titanic= titanic.dropna()
corr = titanic.corr(method='pearson')
corr = corr[corr.Survived!=1]
corr

import matplotlib.pyplot as plt

corr = corr.drop(['PassengerId'], axis ='rows')
corr['Survived'].plot()
corr['Survived'].plot.bar()

[4] 타이타닉 생존자의 나이
import pandas as pd
import matplotlib.pyplot as plt
import numpy as np
import seaborn as sns

titanic = pd.read_table('train.csv',sep=',')

titanic.isnull().sum()
titanic = titanic.dropna()
#titanic.describe()

titanic['Age'].hist(bins=40,figsize=(18,8),grid=True)

#나이별 구분 및 각 나이별 생존율 확인 하기
titanic['Age_cat'] = pd.cut(titanic['Age'],bins=[0,3,7,15,30,60,100],include_lowest=True,labels=['baby','children','teenage','young','adult','old'])
#연령대를 기준으로 평균 값을 구해 볼수 있어요!
titanic.groupby('Age_cat').mean()

#그래프 크기 설정
plt.figure(figsize=(14,5))

# 바 그래프 그리기 (x축 = Age_cat, y축 = Survived)
#sns.barplot('Age_cat','Survived',data=titanic)

# 그래프 나타내기
plt.show()
import pandas as pd

diabetes = pd.read_table('diabetes.csv',sep=',')

#데이터 앞부분 확인 하기
diabetes.head()

#데이터가 null인 데이터 출력하기
print(diabetes.isnull().sum())

#데이터가 null인 데이터 제거 하기
diabetes = diabetes.dropna()

#상관관계 분석하기
corr = diabetes.corr(method='pearson')

#Outcome 상관관계 계수가 1인 요소 제외하고 출력하기
corr = corr[corr.Outcome !=1]
corr

#matplotlib으로 시각화 하기
import matplotlib.pyplot as plt
corr['Outcome'].plot()

#바 그래프로 변경하기
corr['Outcome'].plot.bar()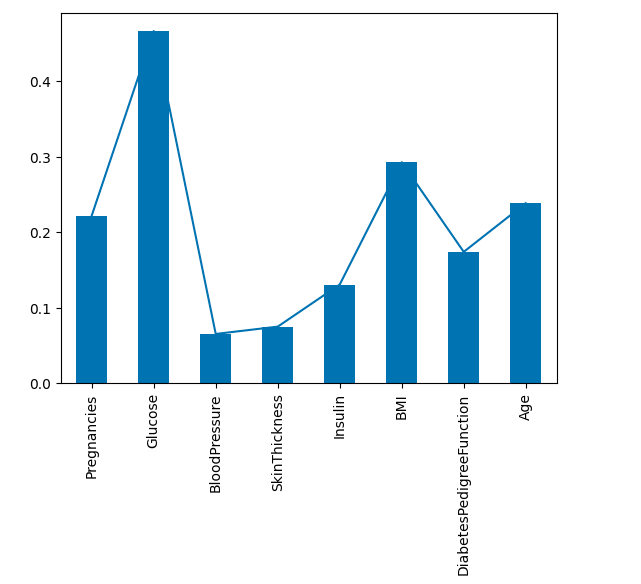
LIST
'Spring & Backend' 카테고리의 다른 글
| [왕초보] 마케터, 기획자를 위한 실전 데이터 분석 4주차[파이썬,python] -스파르타코딩클럽 (0) | 2023.04.11 |
|---|---|
| [왕초보] 마케터, 기획자를 위한 실전 데이터 분석 3주차[파이썬,python] -스파르타코딩클럽 (0) | 2023.04.11 |
| [왕초보] 마케터, 기획자를 위한 실전 데이터 분석 1주차[파이썬,python] (0) | 2023.04.11 |
| 금융인을 위한 파이썬 업무자동화 5주차 (0) | 2023.03.29 |
| 금융인을 위한 파이썬 업무자동화 4주차 (0) | 2023.03.28 |